

Rodney Jones is a retired Chartered Management Accountant and a Statistical Advisor providing advice to NHS organisations in forecasting demand and capacity planning. His publications can be accessed at: https://www.mdpi.com/1660-4601/20/24/7171/s1.
In an earlier article, I highlighted the role of the current NHS funding formula in the financial instability of English Integrated Care Boards (ICBs).1 The funding formula avoids recognising the fundamental role of nearness to death (NTD), sometimes called counting backward from death, in the unacknowledged year-to-year changes in total healthcare costs. This fact has been well researched by economists for over 40 years.2,3
We must therefore investigate the reality of the trends in death and their implication for how the English NHS may experience unacknowledged cost pressures. The UK NHS is funded out of general taxation, which includes national insurance, as a form of non-hypothecated general taxation by another name. The actual NHS funding is determined by parliament in the annual funding process, where the totality of government expenditure competes for the available funds; this includes borrowing. There is seemingly no rational methodology behind what the NHS is given each year relative to the genuine expressed demand, despite well-established NTD methodologies that are capable of such an estimate.2,3
Before the 1990s, the difference between the money allocated to the NHS and the actual cost of running the NHS was reflected in fluctuations in the rate of additions to a growing inpatient waiting list.4 Since the waiting time ‘guarantee’ detailed in the NHS Constitution, this avenue becomes far less effective.4 ‘Slash and burn’ tactics then become the norm among the NHS purchasers, who receive a supposed ‘fair share’ of the NHS allocation via the previously discussed NHS funding formula.1
There is seemingly no rational methodology behind what the NHS is given each year relative to the genuine expressed demand, despite well-established NTD [nearness to death] methodologies that are capable of such an estimate.
Given the primary role of the absolute number of deaths in the totality of health and social care costs,2,3 Figure 1 shows a moving 12-month total of deaths in England over the period January 1949 to March 2024,5 plus the Office for National Statistics (ONS) central forecast for future deaths up to 2052.6 Ignoring the vast changes in healthcare technology and inflation in lifetime healthcare costs over this period, Figure 1 becomes a rough guide to the marginal effect of the approximate 50% of lifetime bed occupancy, and the acute and community costs that occur in the last year of life. This is roughly irrespective of age at death.2,3 In theory, this should reflect the trajectory of funds allocated to the NHS. Figure 1 illustrates several fundamental issues.
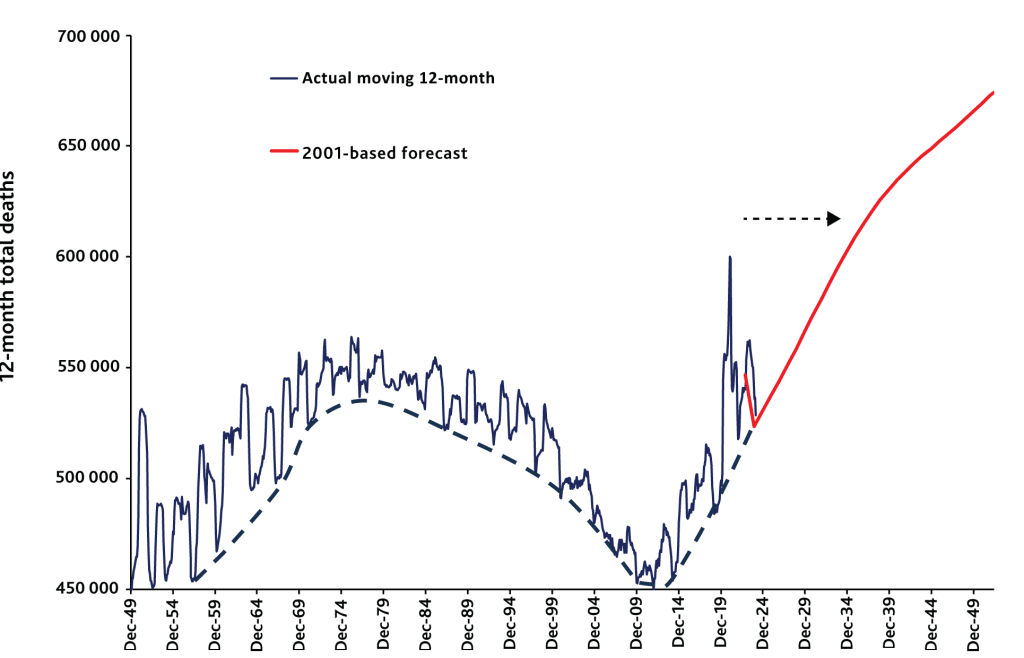
- The First and Second World War baby booms had a profound effect on NTD costs. Each baby boom takes 30 to 40 years for that cohort to die in large numbers. The full impact of the Second World War baby boom began around 2012 and will continue for the next 40 years, as per the ONS forecast.6
- While public health interventions and NHS care can extend lifespan, the NHS has no control whatsoever over the fact that all 2.5 million persons born in the 3 years after the Second World War will eventually die, most doing so after 2012 (that is, those who survived to the age of 66).
- It should be noted that deaths were falling from the 1980s to 2012. Omitting to acknowledge the reality of the NTD effect led to catastrophically flawed capital and staff planning7 as the reality of the inevitable increase in deaths and its associated impact on demand was ignored. Such flawed planning assumptions catastrophically failed once deaths began to rise after 2012. COVID-19 was merely a blip on this upward rise.
- The underlying low pathogen burden dashed trend line is an attempt to show that a form of smooth-line forecast is theoretically possible, but that the real world of NHS costs is profoundly volatile because of the combined direct and indirect health and mortality effects of over 3000 known species of human pathogens.8 It must be stated that no one has any full explanation for the huge year-to-year changes in deaths seen in Figure 1, other than the highly likely direct and indirect effects of human pathogens.
- Also of note are the prolonged periods of unexplained higher deaths when (unpredictable) costs will be consistently above the ‘average’. These periods lead to ‘slash and burn’ attempts to balance the books. These are usually blamed on NHS inefficiency, inability to manage demand, that the NHS is ‘broken’ or ‘overspending’, or any other trivial ‘soundbite’ political excuse.
- Finally, the ONS forecast of deaths to 2052 reveals the sheer magnitude of future NHS NTD-based demand and costs. No one has prepared for this dire reality. It should be observed how the maximum 12-month deaths during the COVID-19 pandemic are reached around 2033 — and I suspect that the ONS forecast is a minimum case.
These points are especially apposite given the known existence of the health insurance underwriting cycle in the US. In this cycle, despite access to vast amounts of data and analytical capacity, US health insurers have, over many decades, experienced a consistent cycle of profit and loss. (See the link in the Author Bio to access the author’s research on this topic.) Why has the Department of Health and NHS England been unable to publicly acknowledge this essential reality? Indeed, why persist in futile efforts to blame the NHS when the ‘fault’ seemingly lies elsewhere?
While politicians have well-intended plans for the NHS, the reality is that such plans get repeatedly foiled by the next world catastrophe. The problem, it would appear, lies not with the NHS or the public.
Reality, rather than political dogma, dictates that health and social care should be funded via hypothecated taxation where the equivalent to the ‘insurance premium’ is calculated based on the principles of NTD, and the reality of highly volatile demand and costs. Resorting to an insurance-based system needlessly increases transaction costs. This is a transparent method that mitigates a ‘slash and burn’ cycle of futile financial management, so vastly detrimental to the NHS and patients. This also aligns with public expectations for a properly funded NHS.
While politicians have well-intended plans for the NHS, the reality is that such plans get repeatedly foiled by the next world catastrophe. The problem, it would appear, lies not with the NHS or the public.
References
- Jones R. Are the English Integrated Care Boards subject to unjustified cost pressures? BJGP Life 2024; 2 Aug: https://bjgplife.com/are-the-english-integrated-care-boards-subject-to-unjustified-cost-pressures/ (accessed 6 Aug 2024).
- Payne G, Laporte A, Deber R, Coyte P. Counting backward to health care’s future: using time-to-death modeling to identify changes in end-of-life morbidity and the impact of aging on health care expenditures. Milbank Q 2007; 85(2): 213–257. https://doi.org/10.1111/j.1468-0009.2007.00485.x (accessed 6 Aug 2024).
- Moore PV, Bennett K, Normand C. Counting the time lived, the time left or illness? Age, proximity to death, morbidity and prescribing expenditures. Soc Sci Med 2017; 184: 1–14. https://doi.org/10.1016/j.socscimed.2017.04.038 (accessed 6 Aug 2024).
- Full Fact. NHS waiting lists: what you need to know in 2024. https://fullfact.org/health/nhs-waiting-lists-pre-election-briefing/?gad_source=1 (accessed 6 Aug 2024).
- Office for National Statistics. Deaths registered monthly in England and Wales. 2024. https://www.ons.gov.uk/peoplepopulationandcommunity/birthsdeathsandmarriages/deaths/datasets/monthlyfiguresondeathsregisteredbyareaofusualresidence (accessed 6 Aug 2024).
- Office for National Statistics. Population projections. https://www.ons.gov.uk/peoplepopulationandcommunity/populationandmigration/populationprojections (accessed 6 Aug 2024).
- Jones RP. A new approach for understanding international hospital bed numbers and application to local area bed demand and capacity planning. Preprints 2024; 2024051435. https://doi.org/10.20944/preprints202405.1435.v1 (accessed 6 Aug 2024).
- Jones RP, Ponomarenko A. Roles for pathogen interference in influenza vaccination, with implications to vaccine effectiveness (VE) and attribution of influenza deaths. Infect Dis Rep 2022; 14(5): 710–758. https://doi.org/10.3390/idr14050076 (accessed 6 Aug 2024).
Featured Photo by Sarah Agnew on Unsplash