Lucy Mitchell is a Community Researcher from East Brighton.
Keith Turner is a Community Researcher from East Brighton.
Liza Bowen is a GP at Wellsbourne Healthcare Community Interest Company and a Lecturer at St George’s, University of London.
GPs across the country will be no strangers to the impact of the cost-of-living crisis on health. In areas of deprivation already suffering from health inequalities, we wanted to understand the additional burden from the recent cost-of-living crisis and how this affected people’s thoughts about the future.
What we did
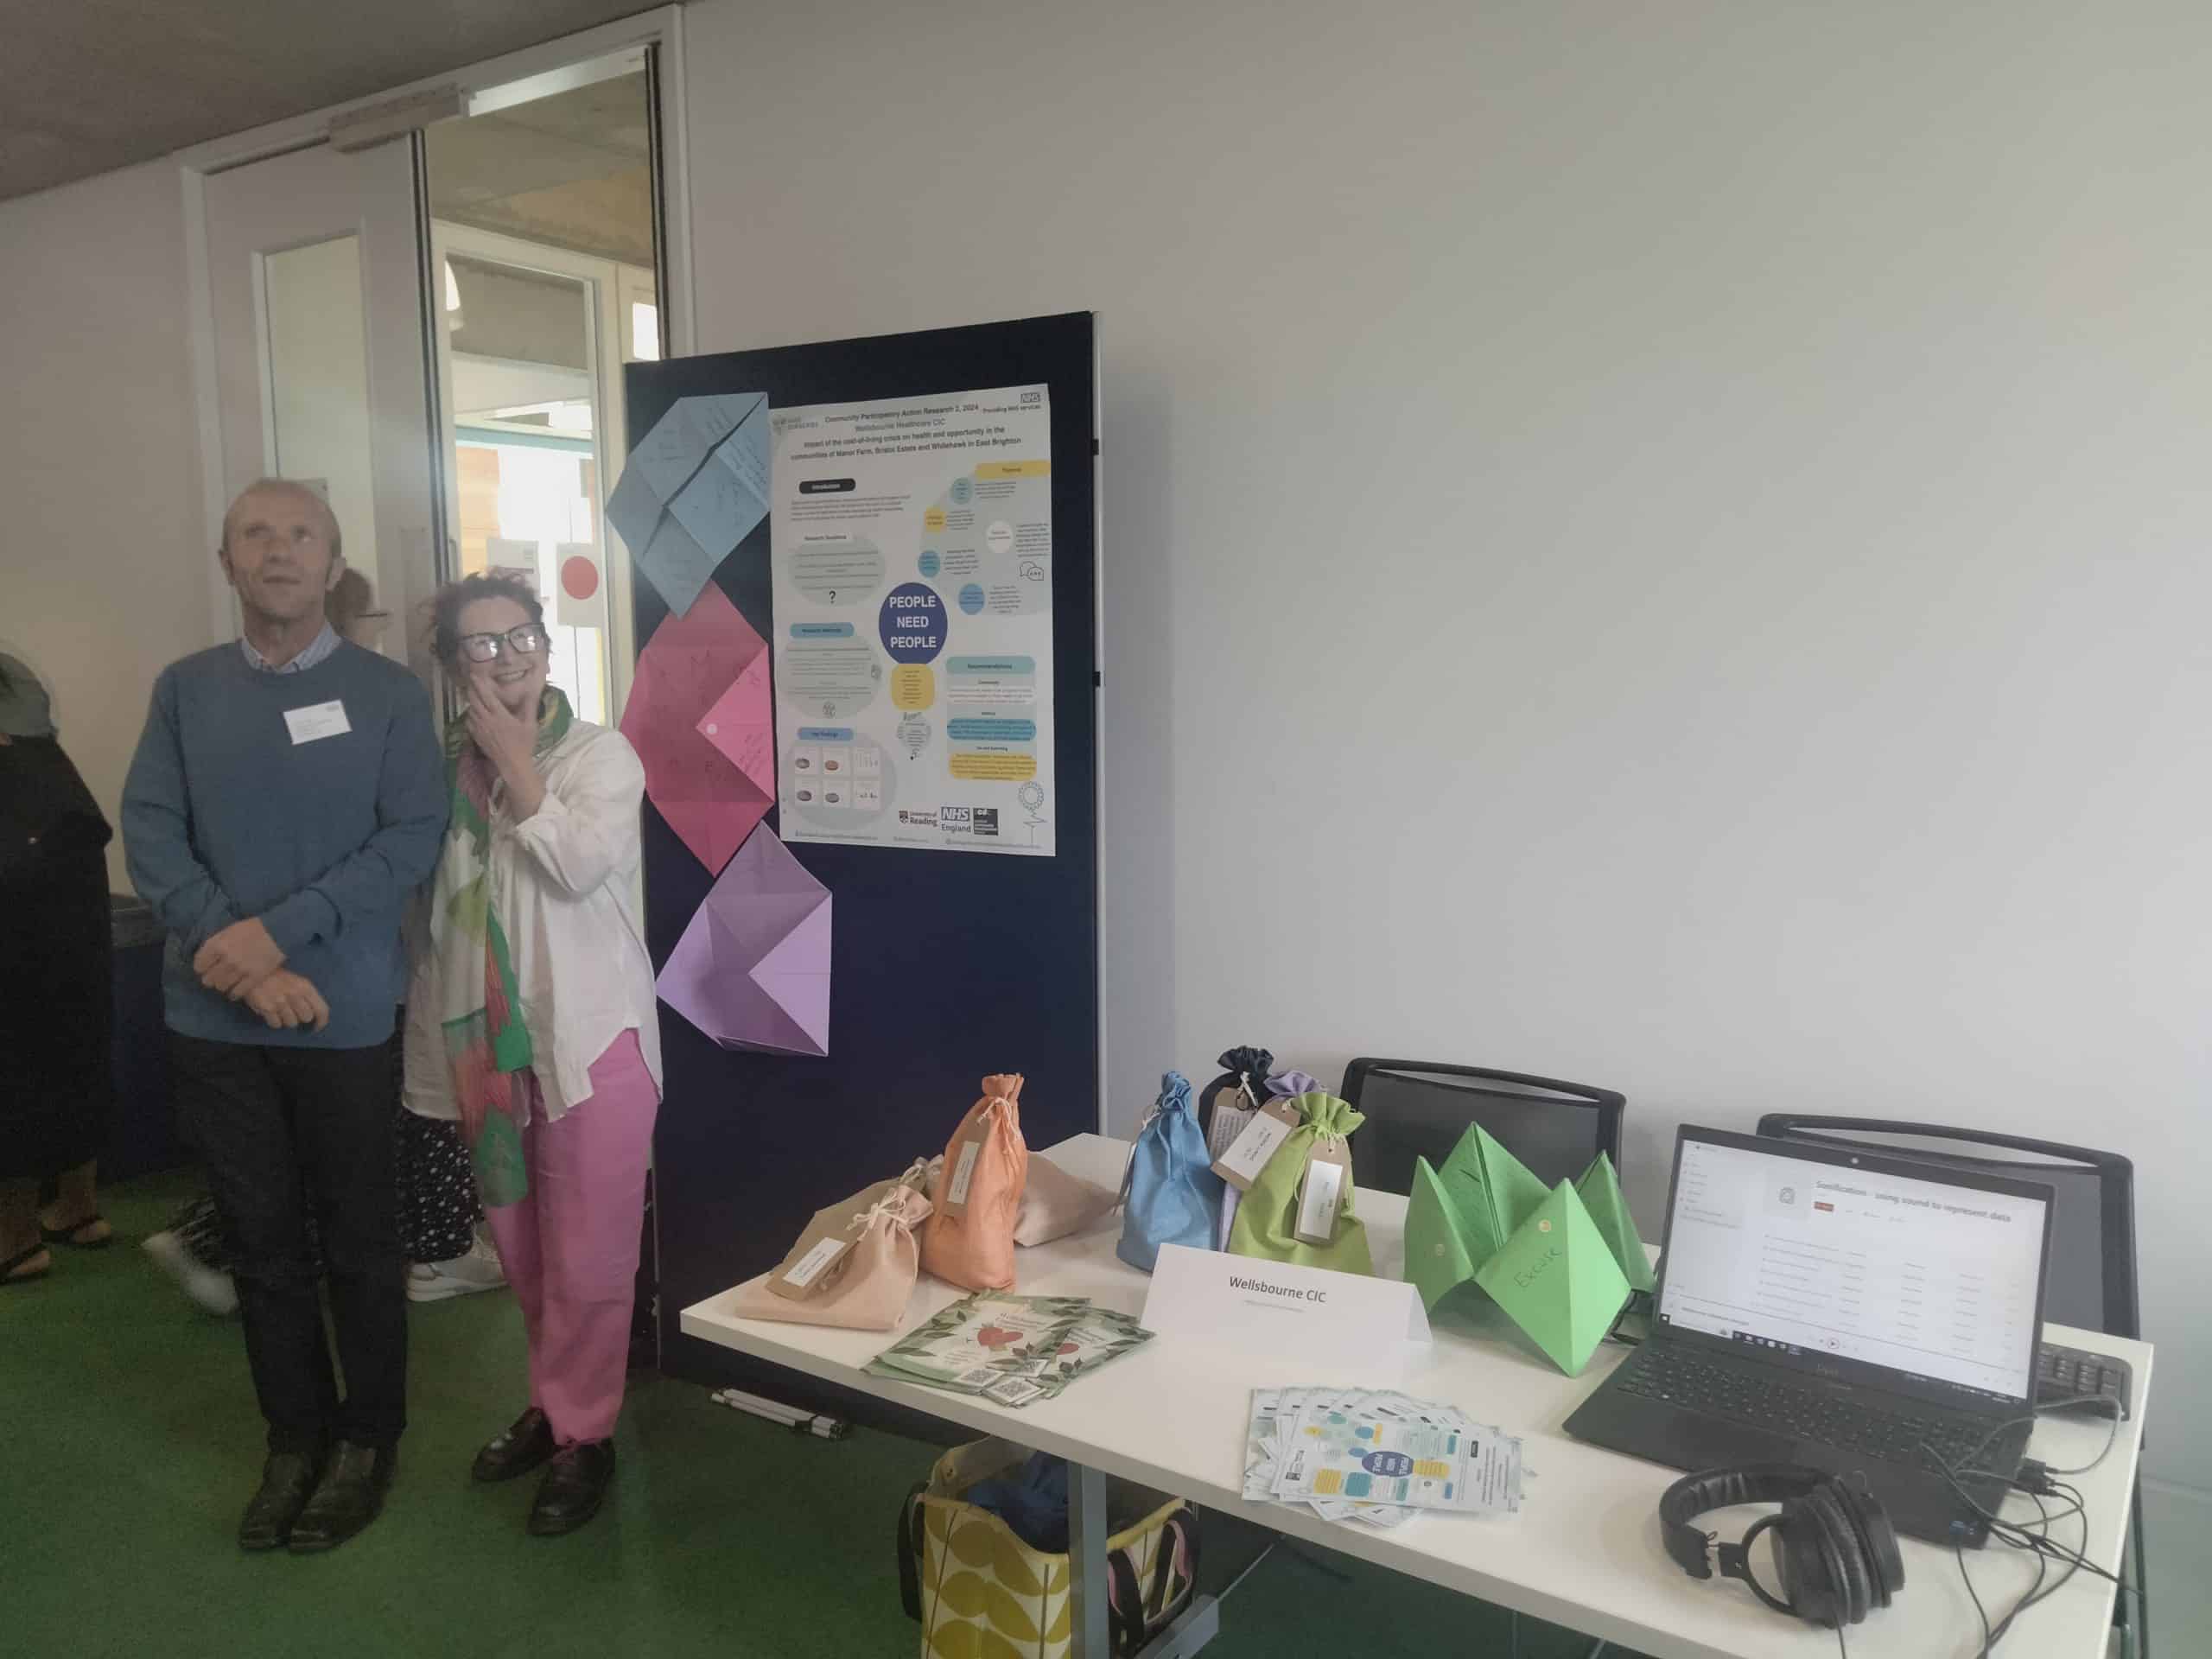
We have recently completed a 1-year NHS-funded community participatory research project looking at experiences of this in our community — an underserved area of East Brighton (Manor Farm, Bristol Estate, and Whitehawk). We completed a survey both in person at local community groups and through text message via Wellsbourne Healthcare Community Interest Company, and conducted a focus group exploring some of the themes in more detail.
“… we explored multi-sensory ways of presenting the data.”
What worked
People wanted to talk. We had 211 responses to the survey, and people were happy to talk in detail about their experiences to trusted members of the community.
The data
We weren’t surprised to find that the cost-of-living crisis had driven the majority of responders (89%) to change shopping and eating habits, made them feel more worried (84%), and had significant impact on hopes for the future (76%). But we wanted to find ways for the numbers not to get lost in a sea of statistics when we presented the work at a regional showcase that included representatives from integrated care boards, public health professionals, and researchers. Led by Keith Turner and his unique insights from having been blind from a young age, we explored multi-sensory ways of presenting the data.
Touch
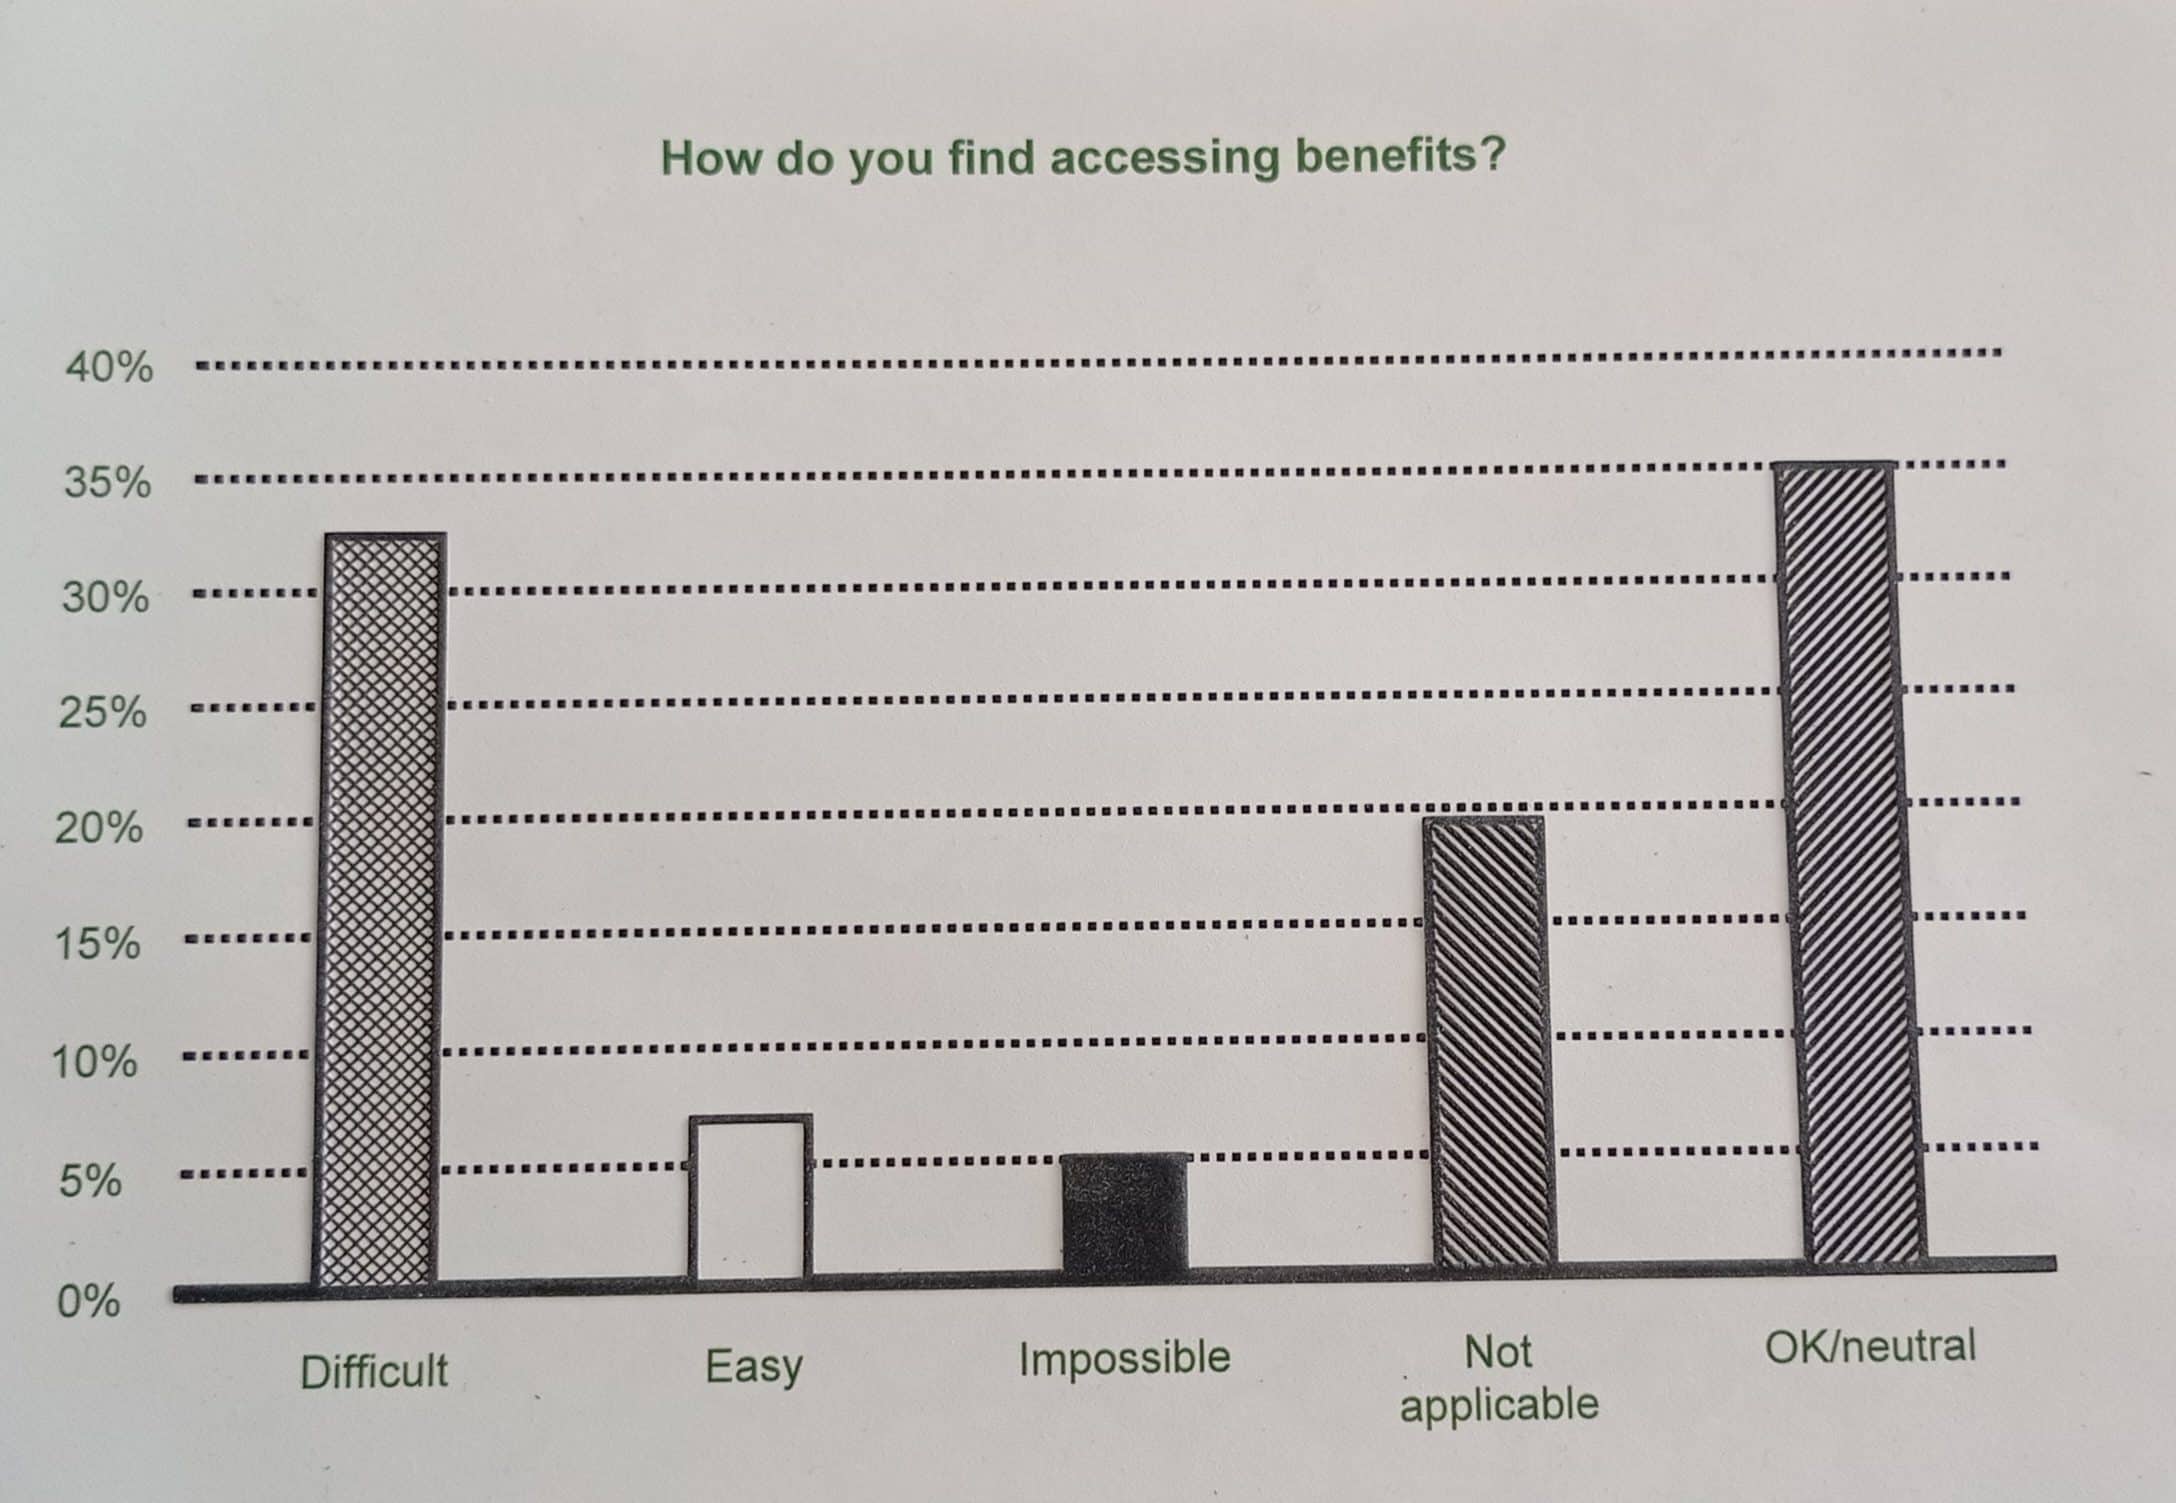
Data are usually presented in a very visual format, whether it be written word, graph, or figure. A simple extension to a bar graph is to put it into tactile form, where the different bars are raised from the paper so the user can experience the differing magnitudes of the bars.
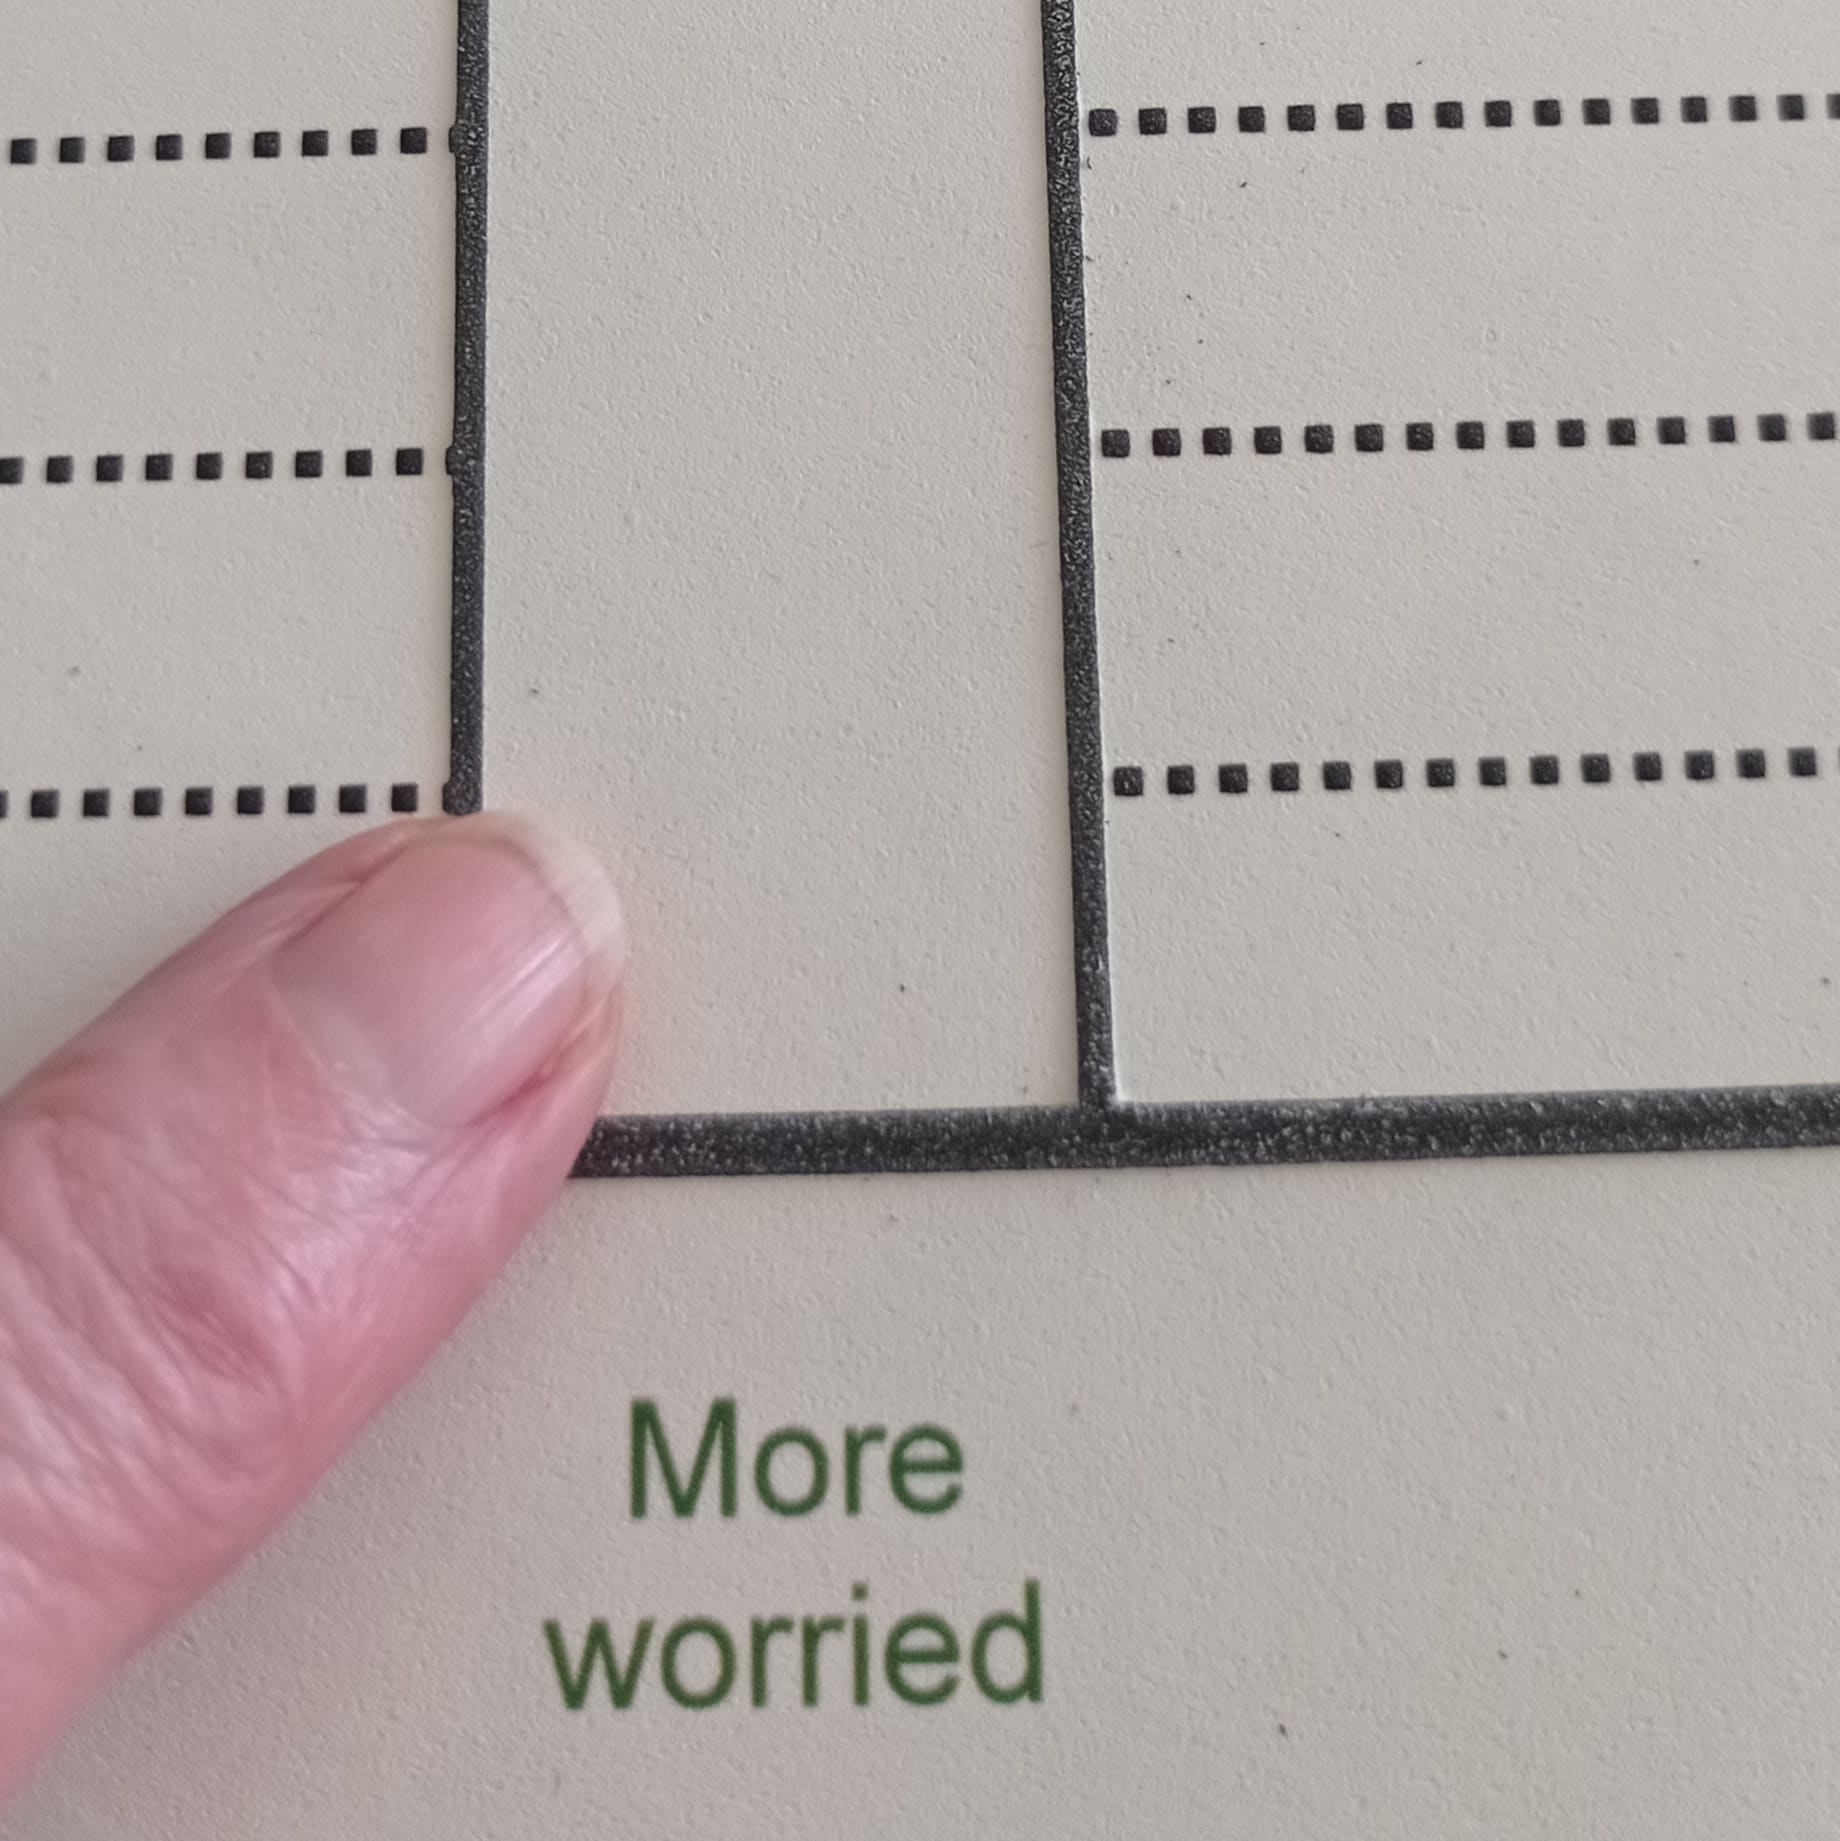
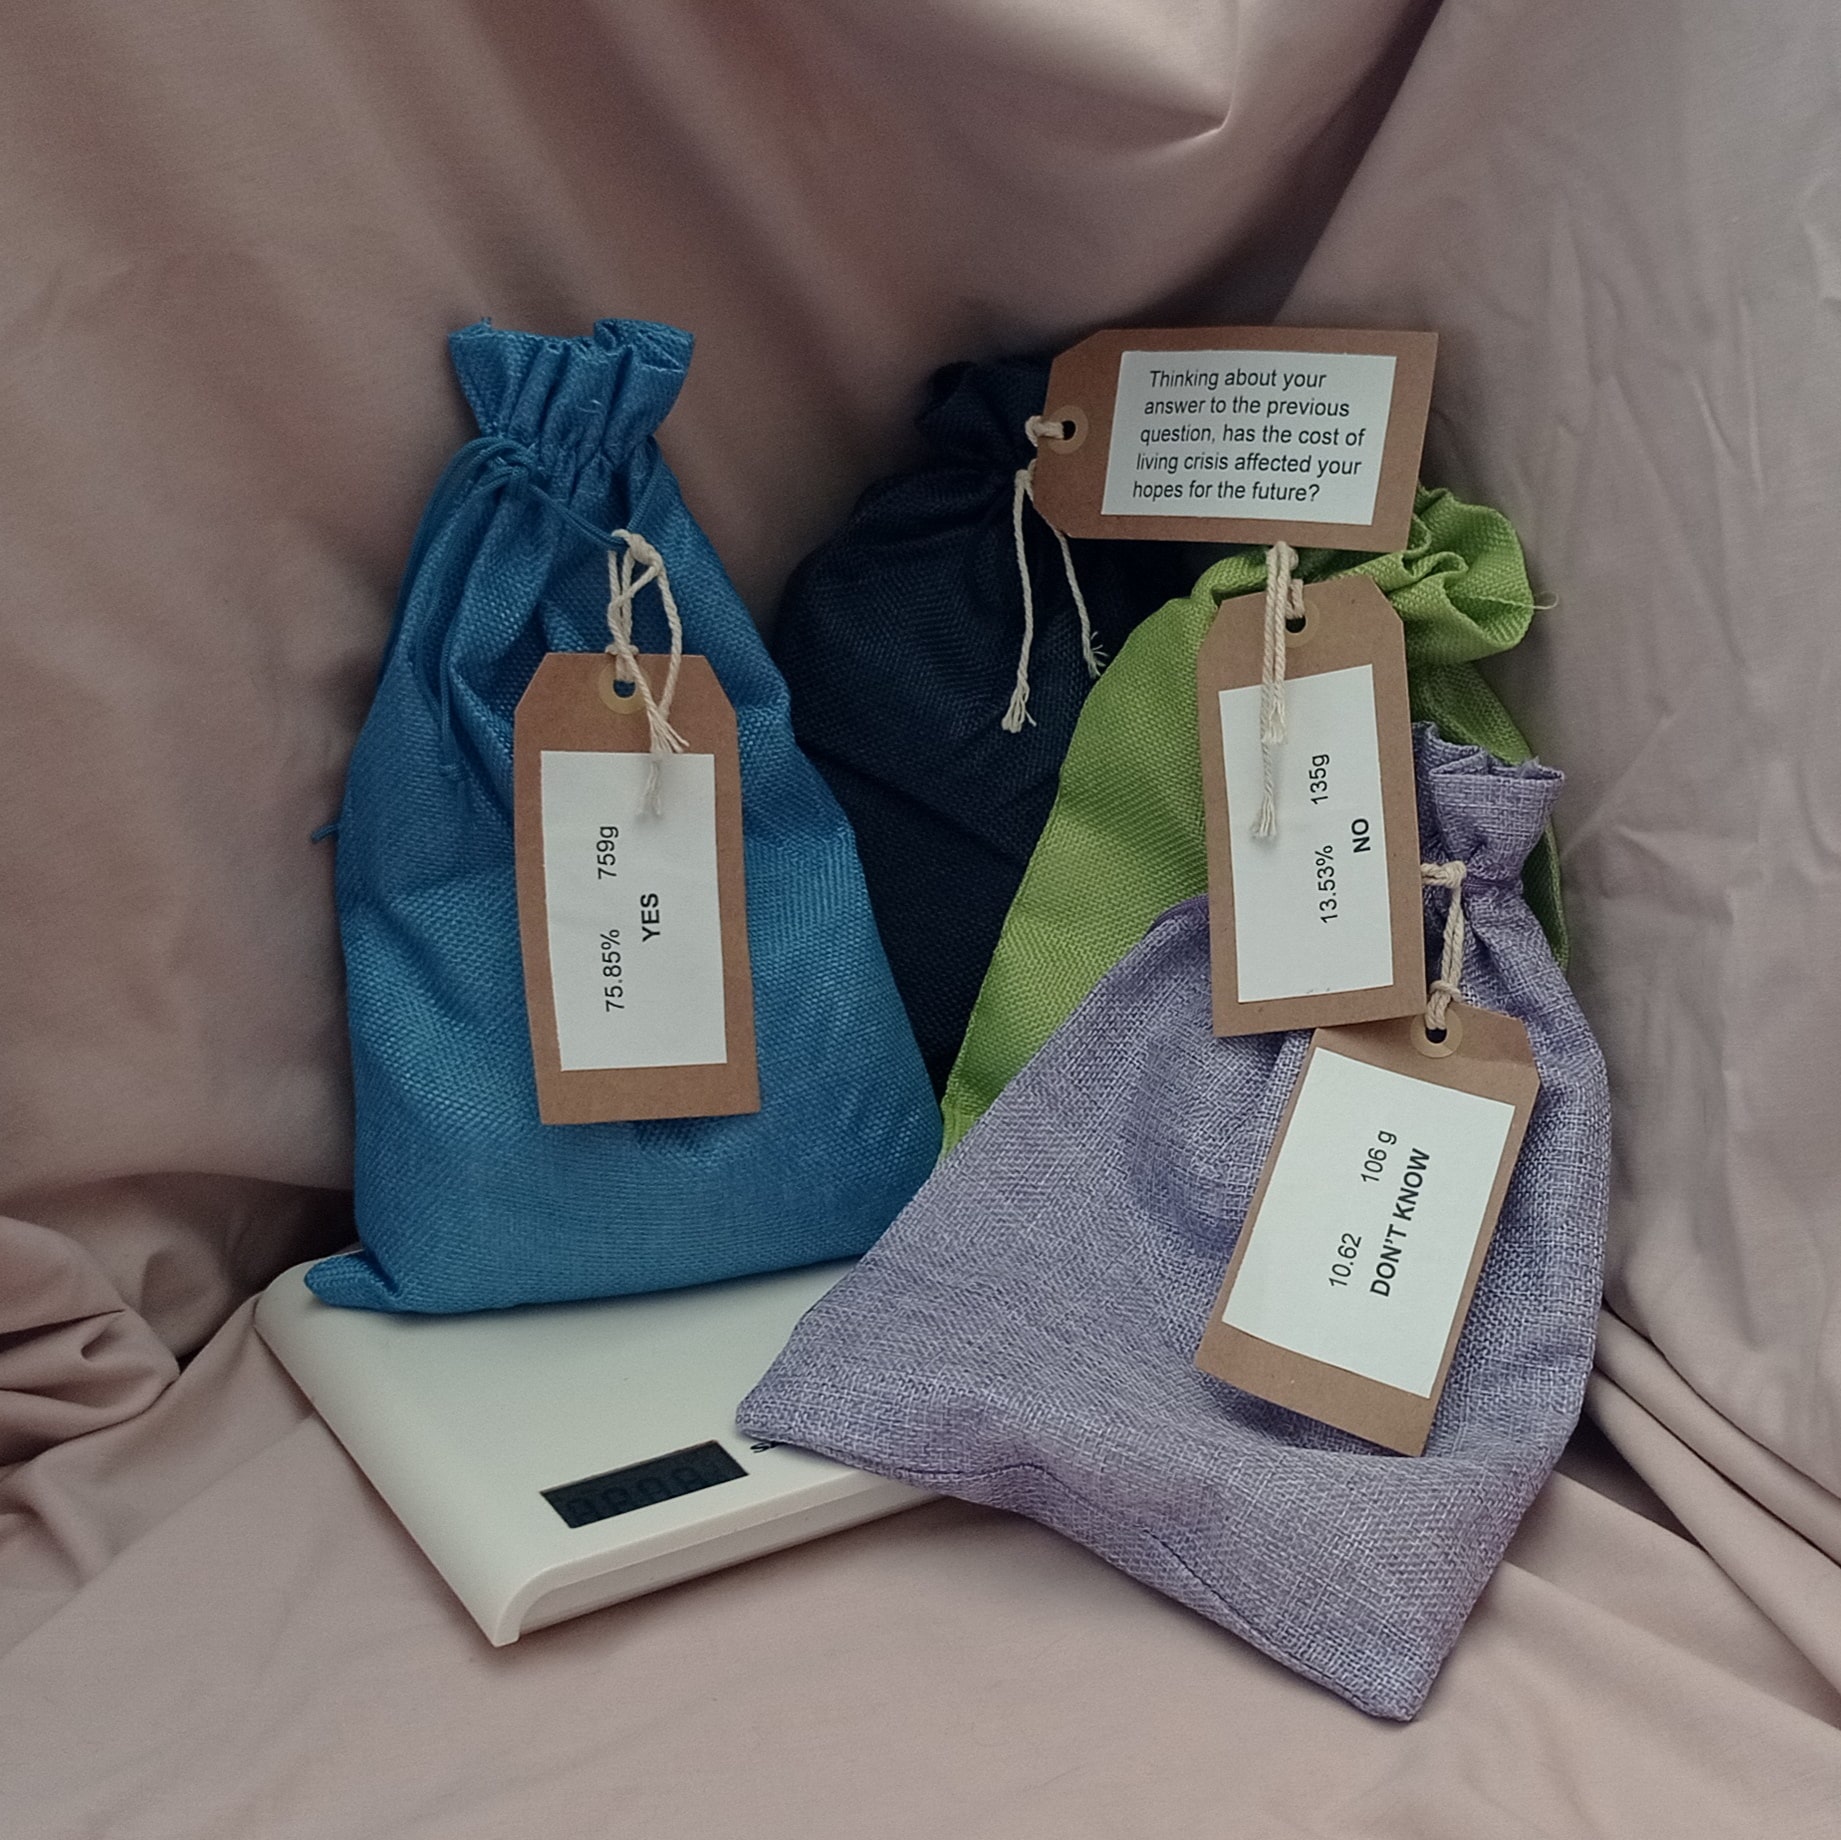
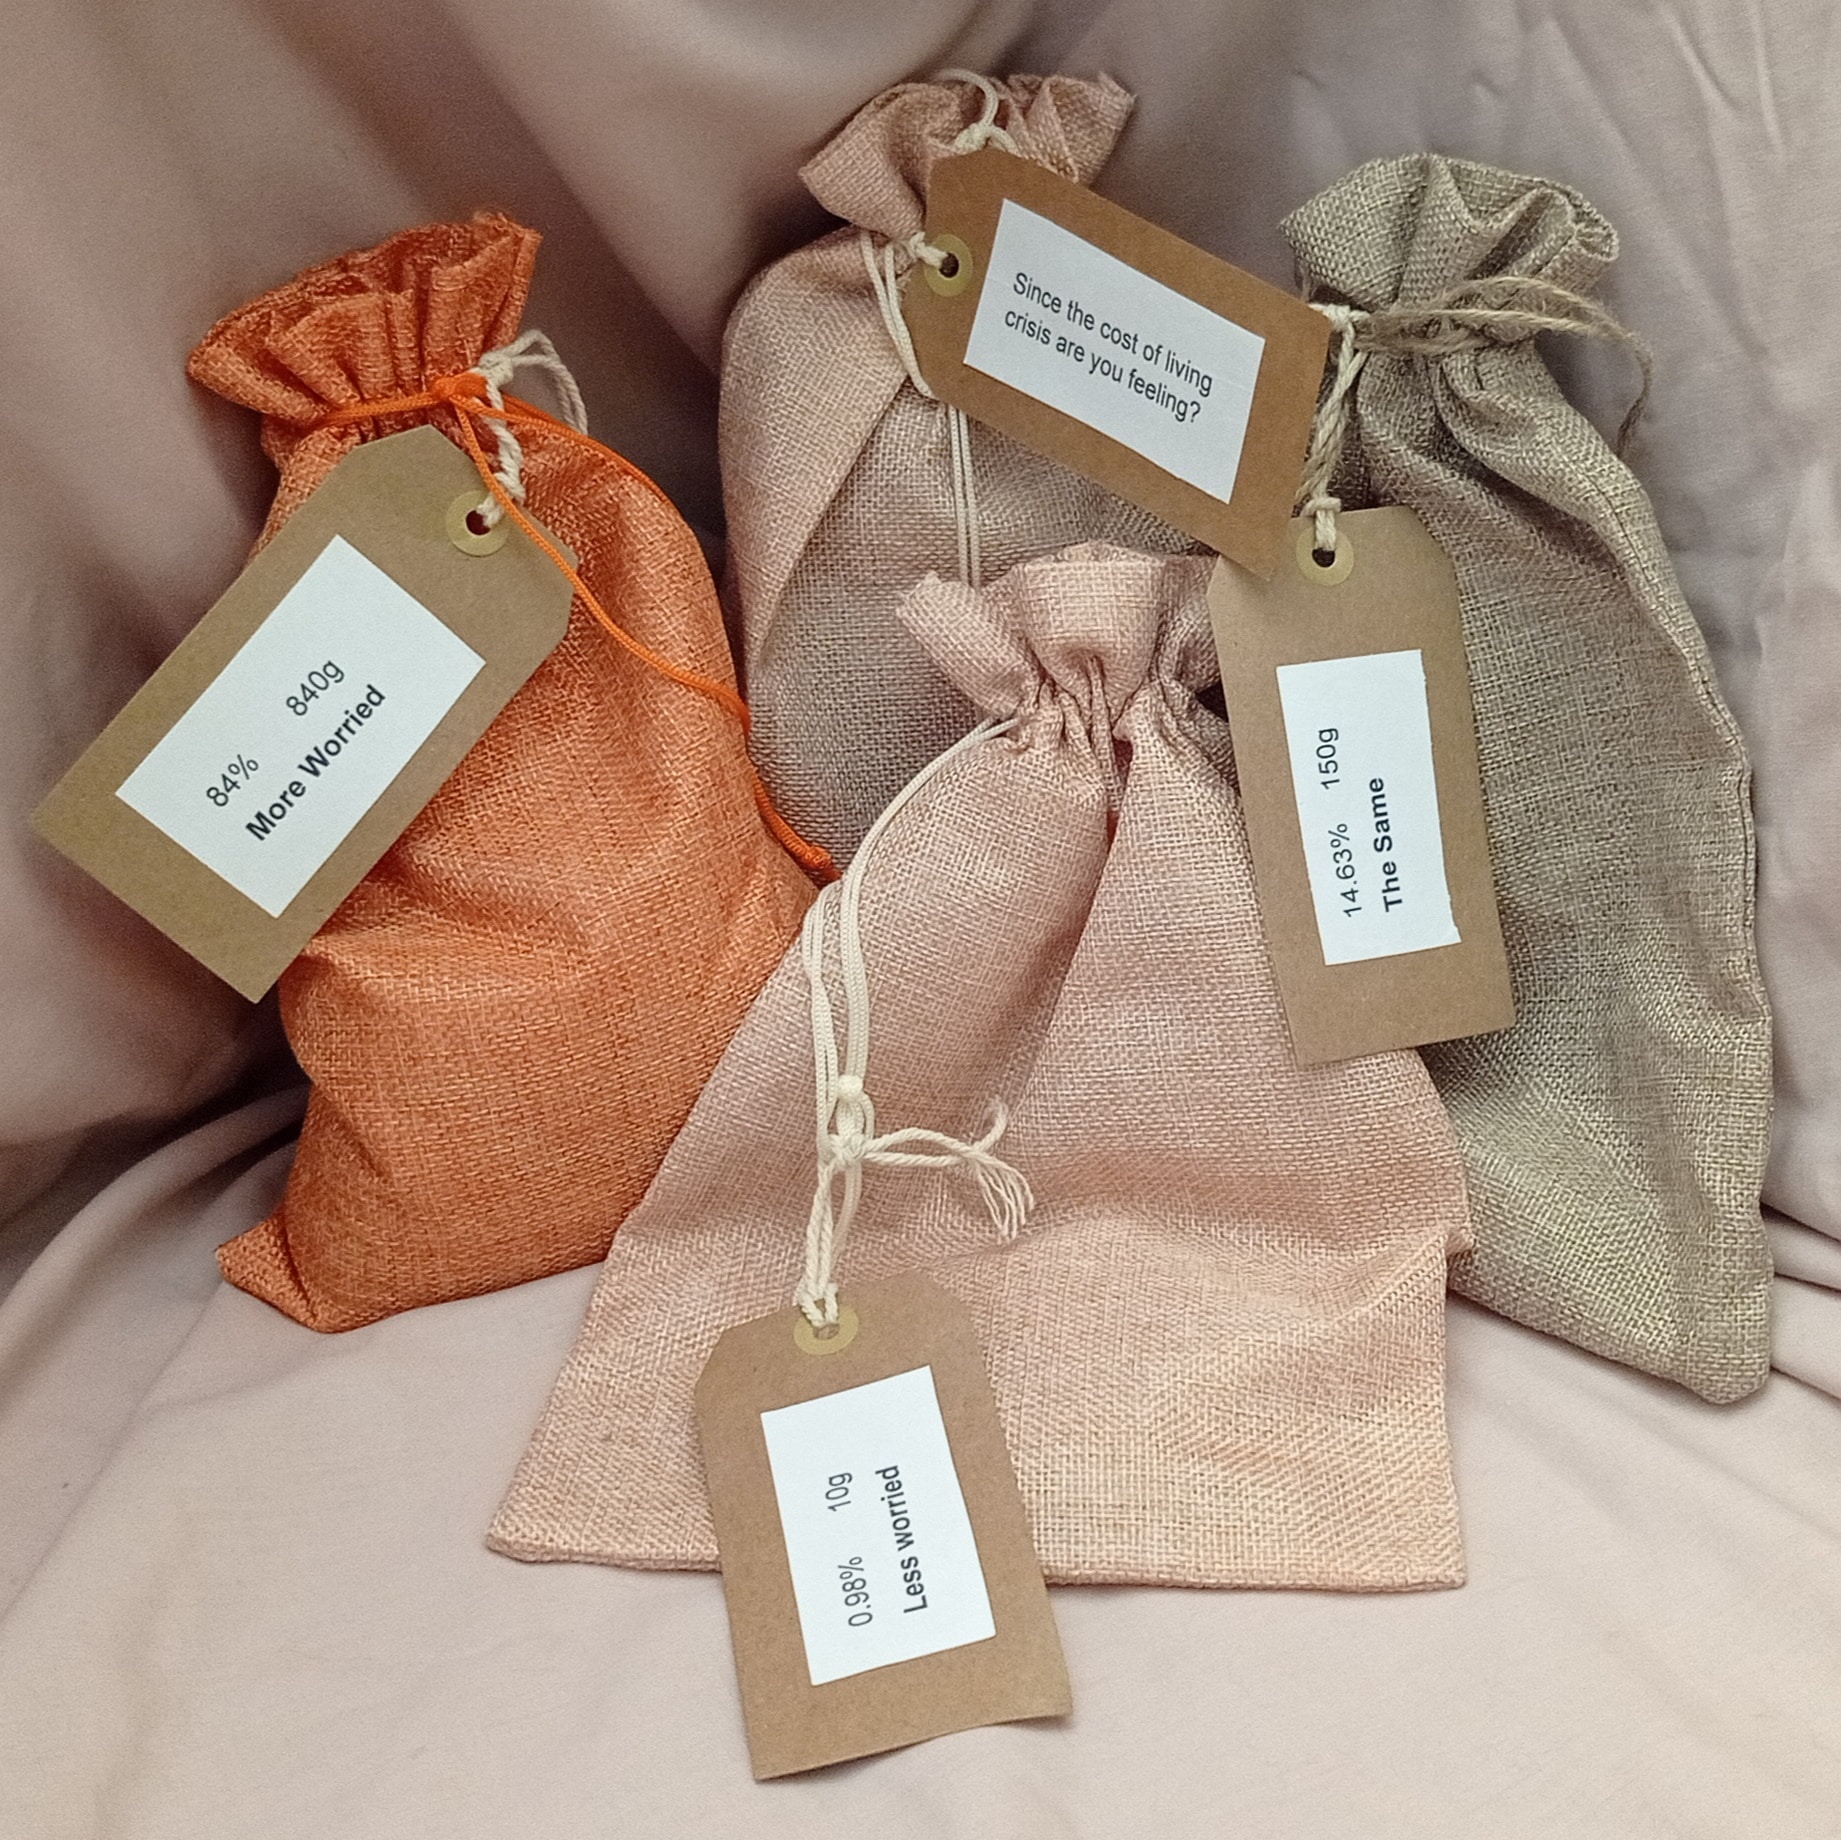
Extending the use of touch further, we represented answers to questions in the form of weight. Hessian bags were filled with an amount of rice proportional to the number of responses to a question option. For example, where 84% of people reported feeling ‘more worried’ since the cost-of-living crisis, this was represented by a weight of 840 g of rice, compared to a weight of 150 g (15%) representing those feeling ‘the same’ and 10 g (1%) representing those feeling ‘less worried’. People commented that feeling this as a weight created a visceral response in a way that is difficult to evoke from reading a number.
Sound
Another way in which we represented our findings was with sonification of results. This is where each response to a survey question is given a different tone, and responses are heard as a series of tones. We would love you to listen to some examples of this that are available at: https://www.scdc.org.uk/wellsbourne-healthcare-cic-audio-files.
We used sonification for five questions and from this created a composition that combines the different question outputs. The purpose of the composition is not to be able to pinpoint specific individual data points, but as a piece to listen to in the context of the rest of our results and the more granular findings. Our next aim is to take this composition back to our community and have a local choir sing it.
Final thoughts
Presenting data in different formats is becoming increasingly popular to improve accessibility to a wide range of audiences. We found that the benefits of different ways of presenting data extended beyond increasing the number of people able to access the data. They provided a way of getting data to cut through the vast amounts of text and visualisations that we are nowadays inundated with in a highly connected world. Engaging with more of our senses emotes reactions. The hope is that we can start to build on this to generate action to help improve the health and wellbeing of our community.
Acknowledgements
With thanks to all our research participants, NHS England South East, Scottish Community Development Centre (SCDC), and Andrew Paterson (SCDC).
Featured image of Lucy Mitchell and Keith Turner at the community project by Liza Bowen.